F5 Firewall Solutions > [Archive3] Flowmon Integrated Out-of-path DDoS Solution > Module – DDoS Attack Source | Edit on
Prepare traffic visualization and monitoring
Connect to Windows jumphost using RDP
Open SSH connections to Router1 and Router2
- Verify Router1 BGP configuration. Protected subnet
10.1.30.0/24should have a Next Hop defined as Router210.1.20.244 show ip bgp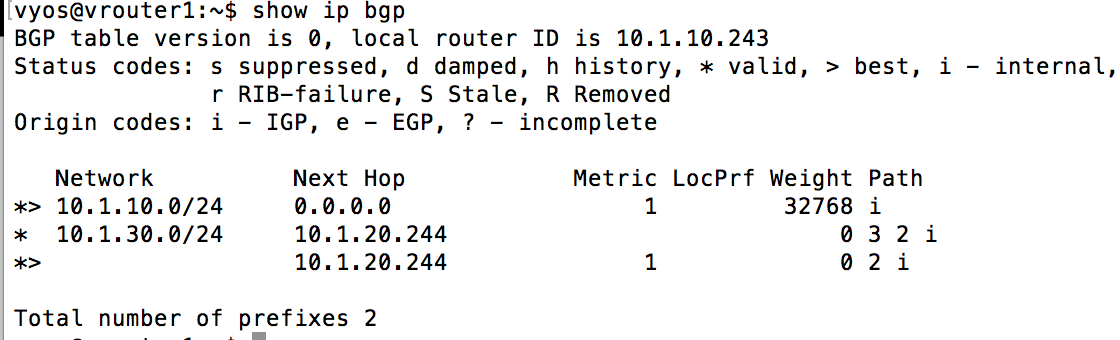
- Verify Router1 BGP configuration. Protected subnet
Start interface monitoring in Router1 and Router2
monitor interfaces ethernet
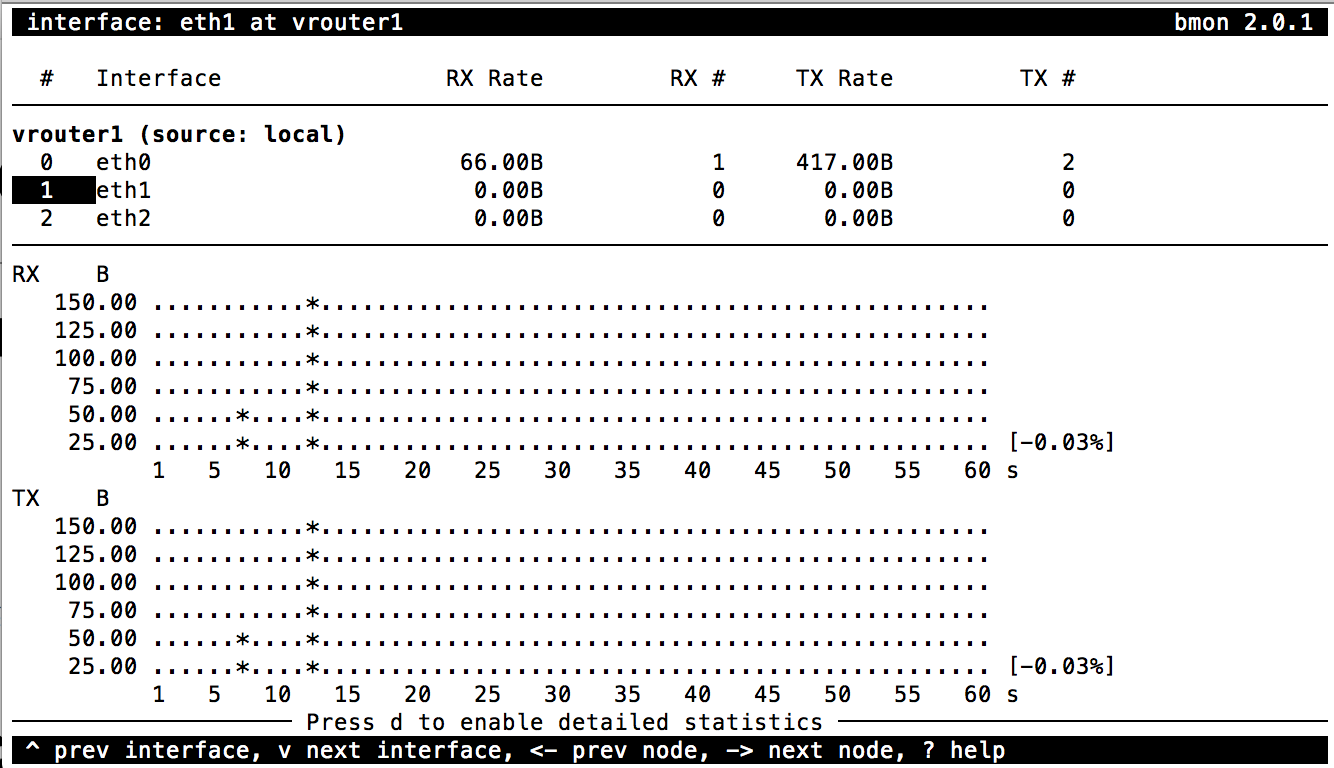

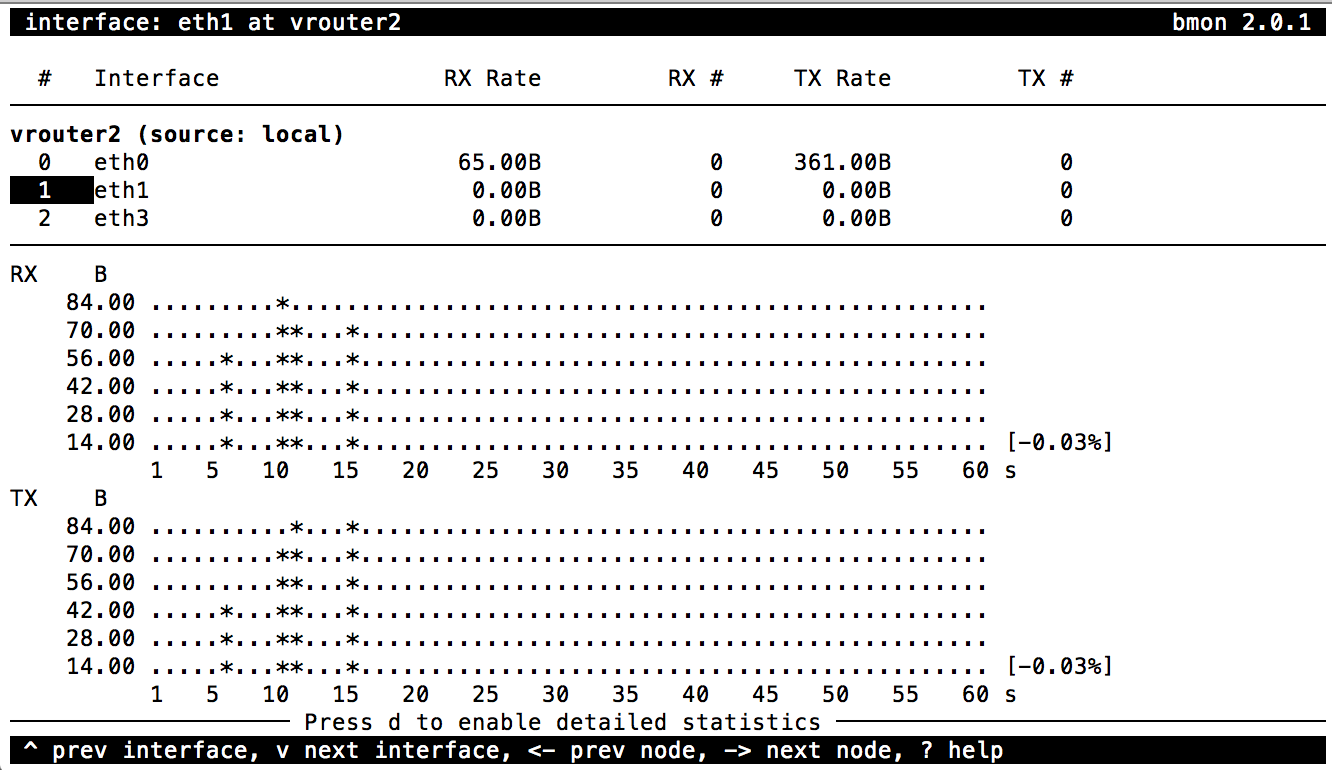
Select eth1 and press
gto enable graphical statisticsNote
You may need to expand terminal window for graphs to appear
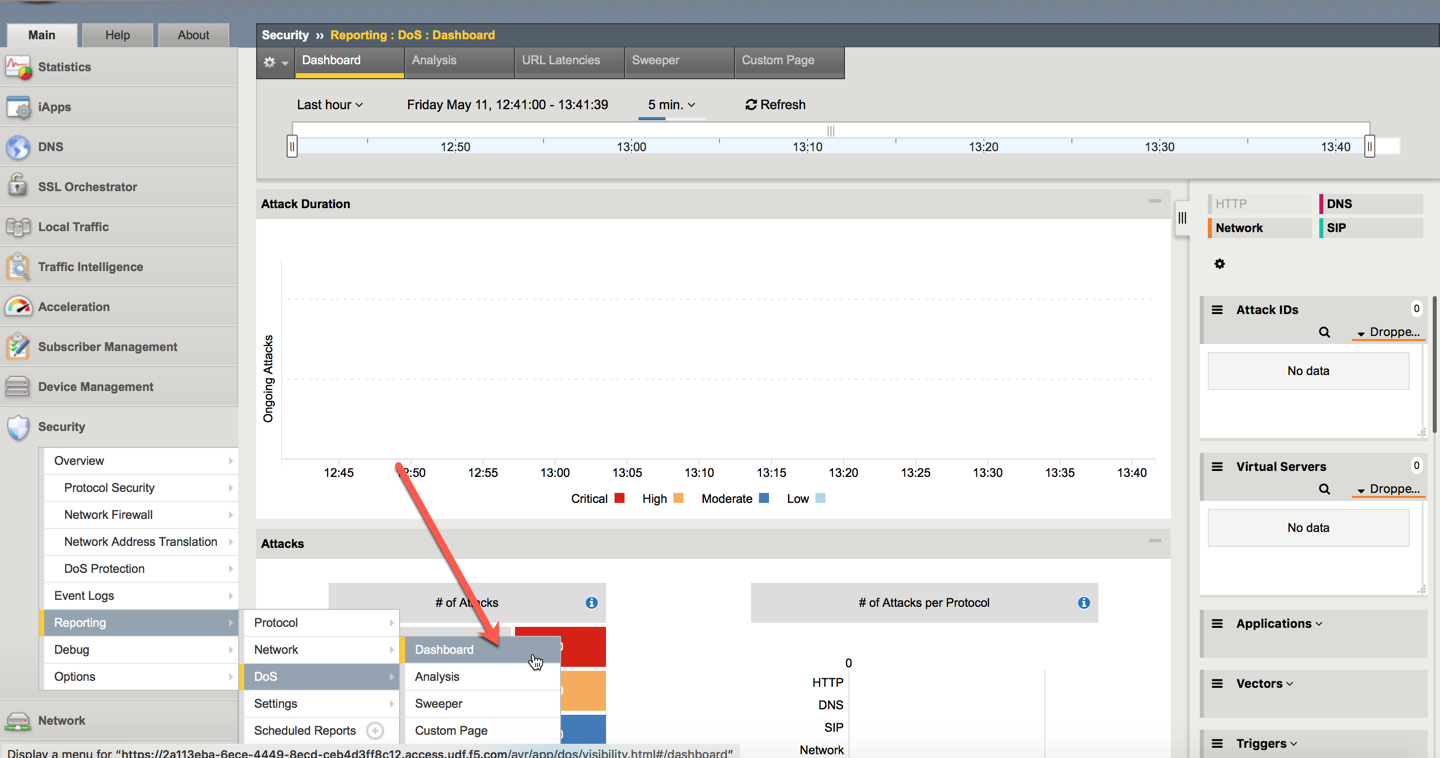
Open Web Browser and click on BIG-IP AFM bookmark, then login into BIG-IP TMUI using
admincredentialsOpen DoS Visibility Dashboard in AFM TMUI
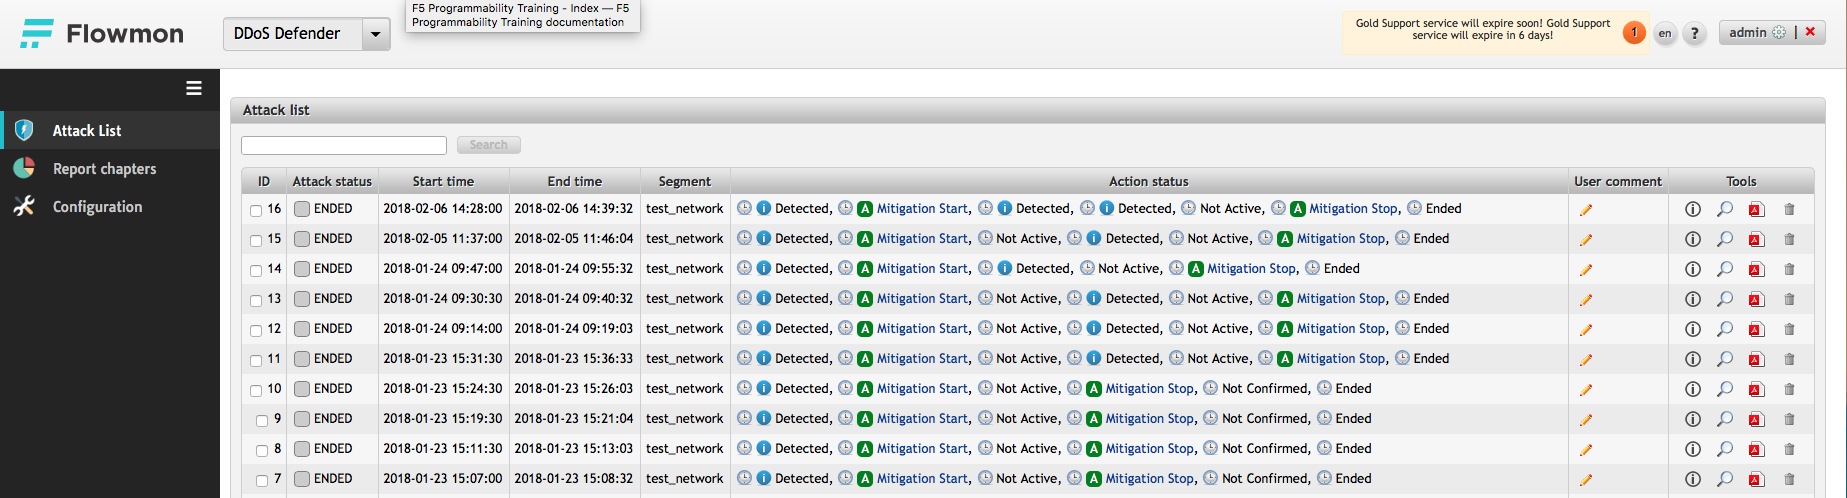
In a new Browser tab click on Flowmon Web interface bookmark. Once Flowmon main menu opens, click on Flowmon DDoS Defender icon and login using
admincredentialsOpen Attack List in Flowmon DDoS Defender WebUI
Note
Disregard any active alarms Flowmon may show in the upper right screen corner. These are artifcts of this lab environment