F5 Firewall Solutions > [Archive1] AFM - The Data Center Firewall > Lab 4 - Device Management Workflows Source | Edit on
Workflow 2: Interacting with the data in the dashboards
- You can narrow the scope of what is graphed by selecting a object or objects from the selection panels on the right. For example, if you only want to see data from BIG-IP01, you can click on it to filter the data.
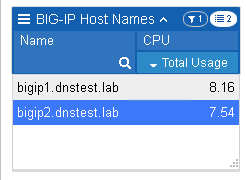
You can create complex filters by making additional selections in other panels
- You can zoom in on a time, by selecting a section of a graph or moving the slider at the top of the page
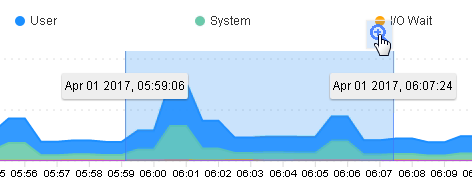 or
or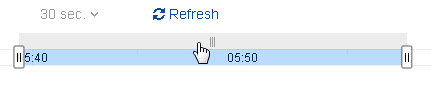
All the graphs update to the selected time.
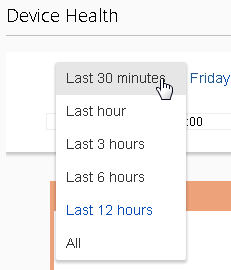
- You can change how far in the data you want to look back by using the selection in the upper left (note you may need to let some time elapse before this option becomes available)